Tag Archives: plotting

Data Storytelling

Inspired by the Storytelling With Data book I wanted to try applying some of the techniques to some existing charts and graphs. In all the examples I have been limited in not having access to the original data, so re-plotting hasn’t really been possible. Instead, I have redrawn using Inkscape or Excel and then focused… Read More »

Seaborn Python Plotting Library

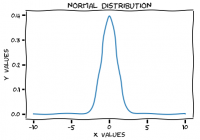
I’ve recently been looking into python packages that could help improve the appearance of matplotlib – the venerable, go-to plotting library for Python. For quickly plotting some data vanilla matplotlib generally does just fine, but for truly ‘publication-ready’ plots, you’ll probably want to look to one of the more advanced libraries. In this post a… Read More »

Origin Linked Axis

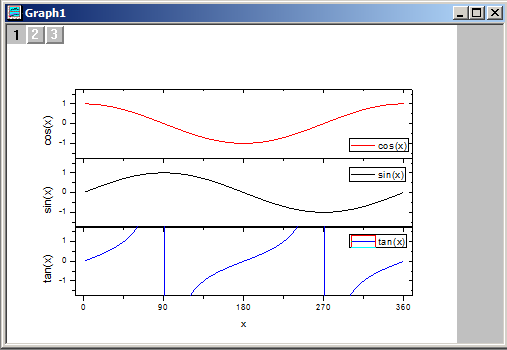
How to Create a Linked Axis in Origin Right click on your graph to bring up the ‘layer management’ dialogue. Add layers if Needed I’m going to be using the layers generated when I created subplots, but you might need to add an extra layer to hold your new axes. You can set up your… Read More »