Seaborn Python Plotting Library
I’ve recently been looking into python packages that could help improve the appearance of matplotlib - the venerable, go-to plotting library for Python. For quickly plotting some data vanilla matplotlib generally does just fine, but for truly ‘publication-ready’ plots, you’ll probably want to look to one of the more advanced libraries. In this post a take a quick look at the Seaborn python plotting library. Seaborn is a broad and powerful package, so you should check it out for yourself to see what it can really do, but hopefully this post will give you a taste, and possibly inspire you to give it a go yourself. Primarily developed by researchers at Stanford University, Seaborn builds on matplotlib, so your existing plotting code should for the most part already be compatible. It’s also well integrated with Pandas, a data structure and analysis library for python. Seaborn is still very much in active development, so you can expect a few bugs, but also rapid bug fixes and new features. Many of the features of Seaborn are aimed at advanced statistical processing and plotting, but even basic usage can help deliver better looking plots.
Take things further with the Seaborn tutorial
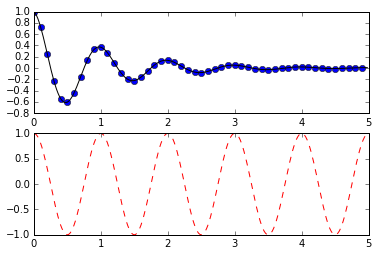
I’m going to be modifying the multiple plot example from the matplotlib documentation. First of all let’s look at the default matplotlib output:
 |
|---|
| seaborn python matplotlib default |
And now let’s see what happens when we import the Seaborn package. Although Seaborn has its own plot types, its styles can be applied equally well to the standard matplotlib plots. To turn on the Seaborn styles, you just need to import the module:
1
import seaborn as sns
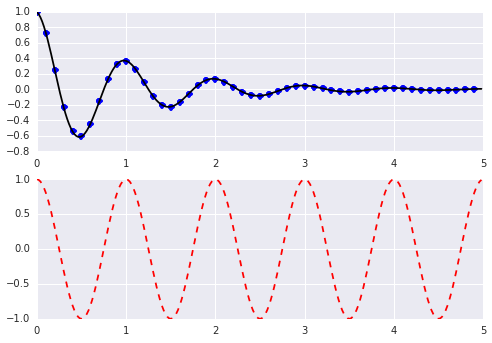
Here’s the Seaborn output.
 |
|---|
| seaborn python - seaborn |
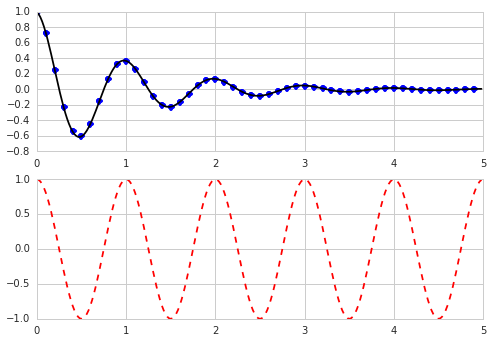
If you’re not too keen on the grey background, we can easily change from the default grey background, to a more conventional white with the command
1
sns.set_style("whitegrid")
 |
|---|
| seaborn python - whitegrid |
Another nice touch is the use of ‘contexts’ which you can use to set and save appearance parameters. The standard ones are notebook (the default), poster, talk, and paper context. Here’s an example of the ‘paper’ context, which makes the plot more compact, so as to fit better into a paper.
 |
|---|
| seaborn python - paper |
One final cool feature I’d like to point out is the broad range of colours and colour palettes available, including the 954 named colours produced by the xkcd colour survey.