Category Archives: Design

Data Storytelling

Inspired by the Storytelling With Data book I wanted to try applying some of the techniques to some existing charts and graphs. In all the examples I have been limited in not having access to the original data, so re-plotting hasn’t really been possible. Instead, I have redrawn using Inkscape or Excel and then focused… Read More »

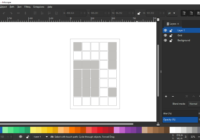
Inkscape Grid Layout

Grid layouts are an important technique in graphic design. This blog post shows how you can make an Inkscape grid layout using another open source publishing tool Scribus. Inkscape Grid Layout Scribus is an open source desktop publishing application and comes with a nice tool for breaking a page up into grids. This is much… Read More »

Basic Fonts

The designer Massimo Vignelli once said that you only really need around 6 fonts. The logic of that approach is that rather than spending ages trying to find the ‘perfect’ font from all the thousands that are available, you focus on a reduced range of basic fonts. This creative constraint then gives you more space… Read More »