Extend Plot Range Of Fit In Origin
In this post I show you how to extend the plot range of the fitted function in Origin, beyond that of your initial data. Origin makes it easy to fit to your data, but how to extend the fit beyond the range of the original data isn’t obvious. Follow the steps below to find out how.
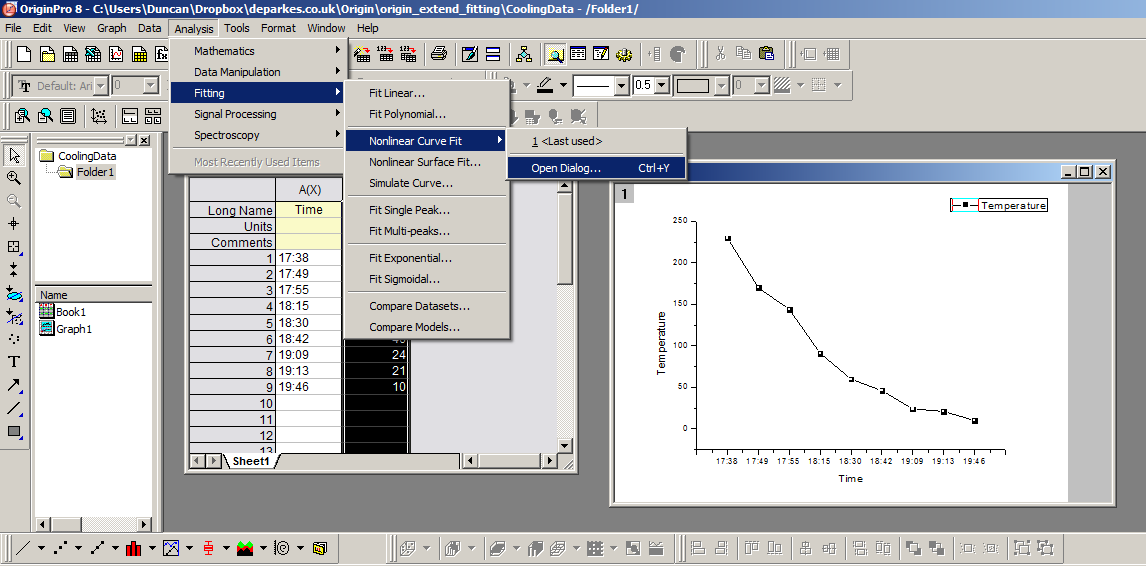
1. Select Your Fit Function
The first stage is to select your fit function as you would do normally. In my case I have some data showing cooling over time, which I’ll fit with a simple falling exponential, via the non-linear curve fitting tool.
 |
|---|
| non-linear curve fit 2 |
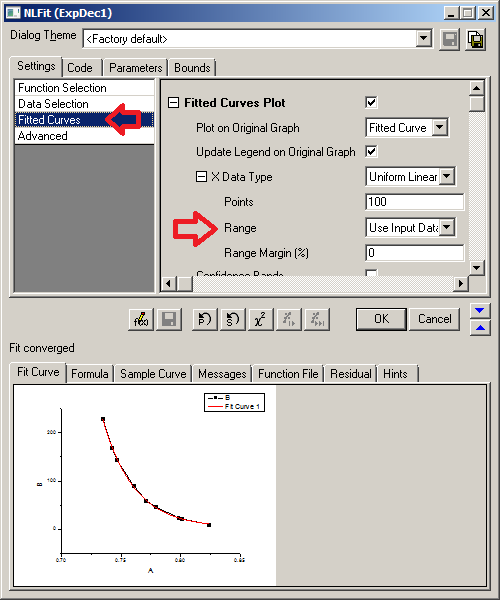
2. Extend Plot Range
To extend the plot range of the fitted function, you need to select the ‘Fitted Curves’ options on the ‘Settings’ tab.
 |
|---|
| FittedCurves |
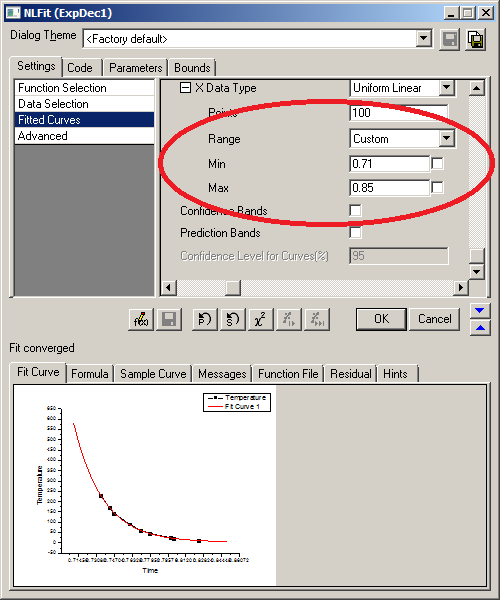
Under the x-data type you can change the ‘Range‘ from ‘Use Input Range’ to ‘Custom’, which allows you to set the Max and Min range for the fit.
 |
|---|
| FittedCurves - Custom Range |
Hit ‘Fit Till Converged’ and you’ll see that the fit now extends beyond the original data range. (I found that I sometimes had to click on some of the grey background of the settings window, near to the Min/Max numbers for them to be ‘set’.) If you don’t have a definite range you need to show, you might need to play around with the maximum and minimum values until you have a range you are happy with (make sure you hit ‘Fit Till Converged’ each time).
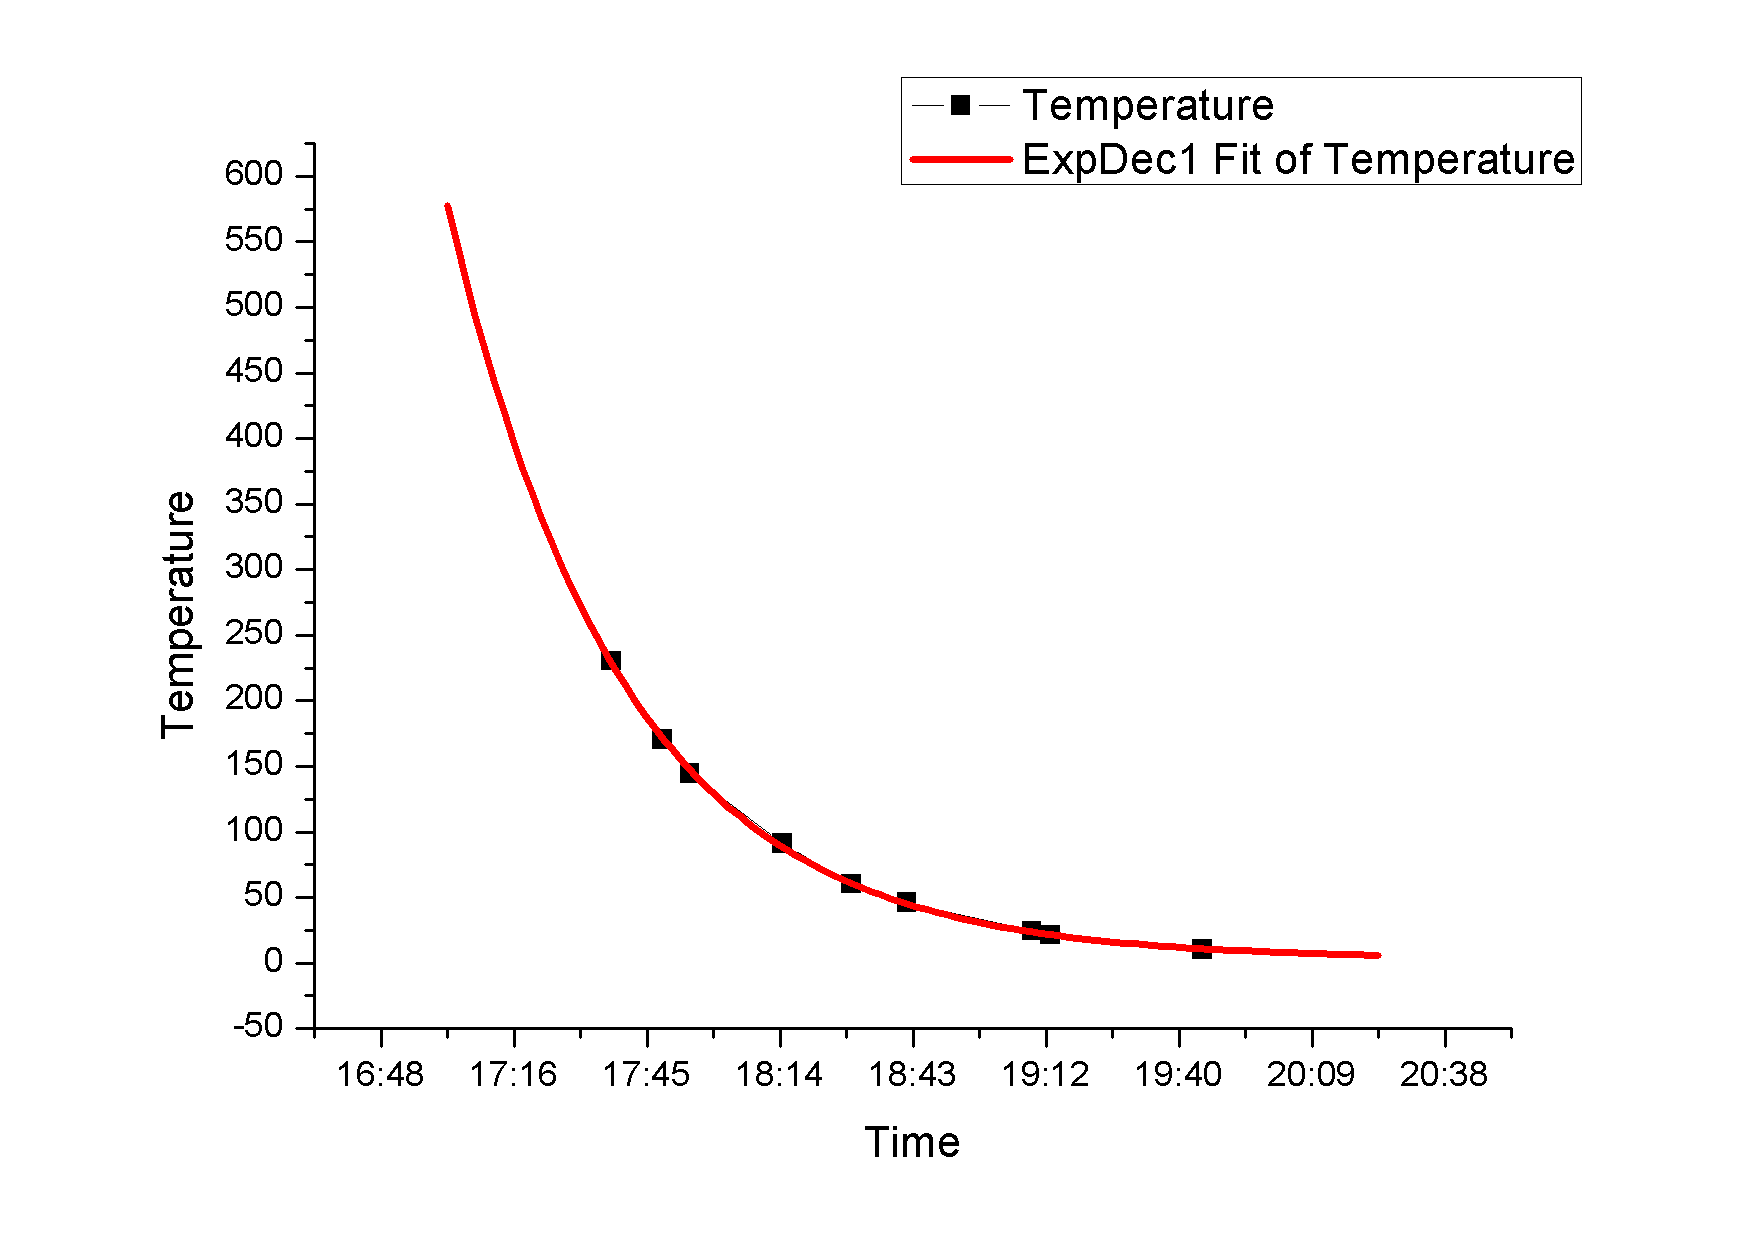
3. Output Plot
The fit function now extends beyond the original data, so you can predict behaviour higher and lower than your initial values.
 |
|---|
| FittedCurves - Output plot |