Matplotlib XKCD Style Plots
Matplotlib is the excellent workhorse plotting library for python. As great as matplotlib is, it could occasionally do with a little stylistic improvement [1] [2]. I recently came across a cool feature in matplotlib that lets you plot in the style of the popular XKCD comics, with a fun font and a more ‘sketchy’ line style.
Using xckd-style plots is not just for fun. You can use the xkcd style when you want to emphasise the uncertainty in your modelling or analysis. They look so unofficial that your audience or reader will have to question if your analysis is correct or not.
Matplotlib XKCD Style Plots
Matplotlib XKCD style plots are easy to create - it is as simple as including ‘plt.xkcd()’ at the start of your plotting script. For example:
1
2
3
4
5
6
7
8
9
10
11
12
from matplotlib import pyplot as plt
import numpy as np
from scipy.stats import norm
plt.xkcd():
x_axis = np.arange(-10, 10, 0.001)
mu = 0
variance = 1
plt.plot(x_axis, norm.pdf(x_axis,mu,variance))
plt.xlabel('X VALUES')
plt.ylabel('Y VALUES')
plt.title('NORMAL DISTRIBUTION')
plt.show()
Which should output this
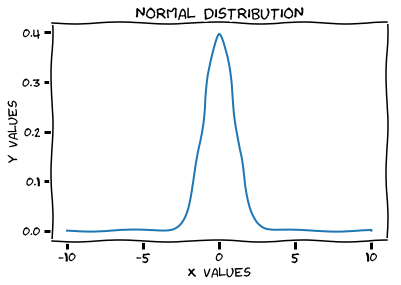 |
|---|
| Matplotlib XKCD Style - xkcd |
More Control Over XKCD Plots
You will find that once you have included plt.xkcd() in your scripts all of your plots in that session will have an xkcd style. To have a bit more control over the xkcd style, you can use ‘with plt.xkcd()’ instead. For example.
1
2
3
4
5
6
7
8
9
10
11
12
13
14
15
16
17
18
19
20
21
22
from matplotlib import pyplot as plt
import numpy as np
from scipy.stats import norm
# An xkcd-style plot
with plt.xkcd():
    x_axis = np.arange(-10, 10, 0.001)
    mu = 0
    variance = 1
    plt.plot(x_axis, norm.pdf(x_axis,mu,variance))
    plt.xlabel('X VALUES')
    plt.ylabel('Y VALUES')
    plt.title('NORMAL DISTRIBUTION')
    plt.show()
# The same plot with matplotlib defaults
x_axis = np.arange(-10, 10, 0.001)
mu = 0
variance = 1
plt.plot(x_axis, norm.pdf(x_axis,mu,variance))
plt.xlabel('X VALUES')
plt.ylabel('Y VALUES')
plt.title('NORMAL DISTRIBUTION')
plt.show()
This code will produce two plots of the same data, but with different styles. The second one will use matplotlib defaults and look more like this:
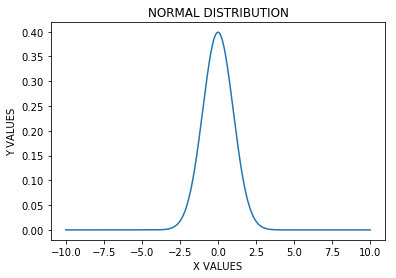 |
|---|
| Matplotlib XKCD Style - defaults |
Improve the Text
To improve the appearance (or at least make it more like XKCD), you can install the font ‘Humor Sans’. After you install the Humor Sans font you might find that matplotlib cannot find it immediately. To help things you can reset the matplotlib font manager with:
1
2
import matplotlib
matplotlib.font_manager._rebuild()