Tag Archives: plotting

How to create Origin Subplots

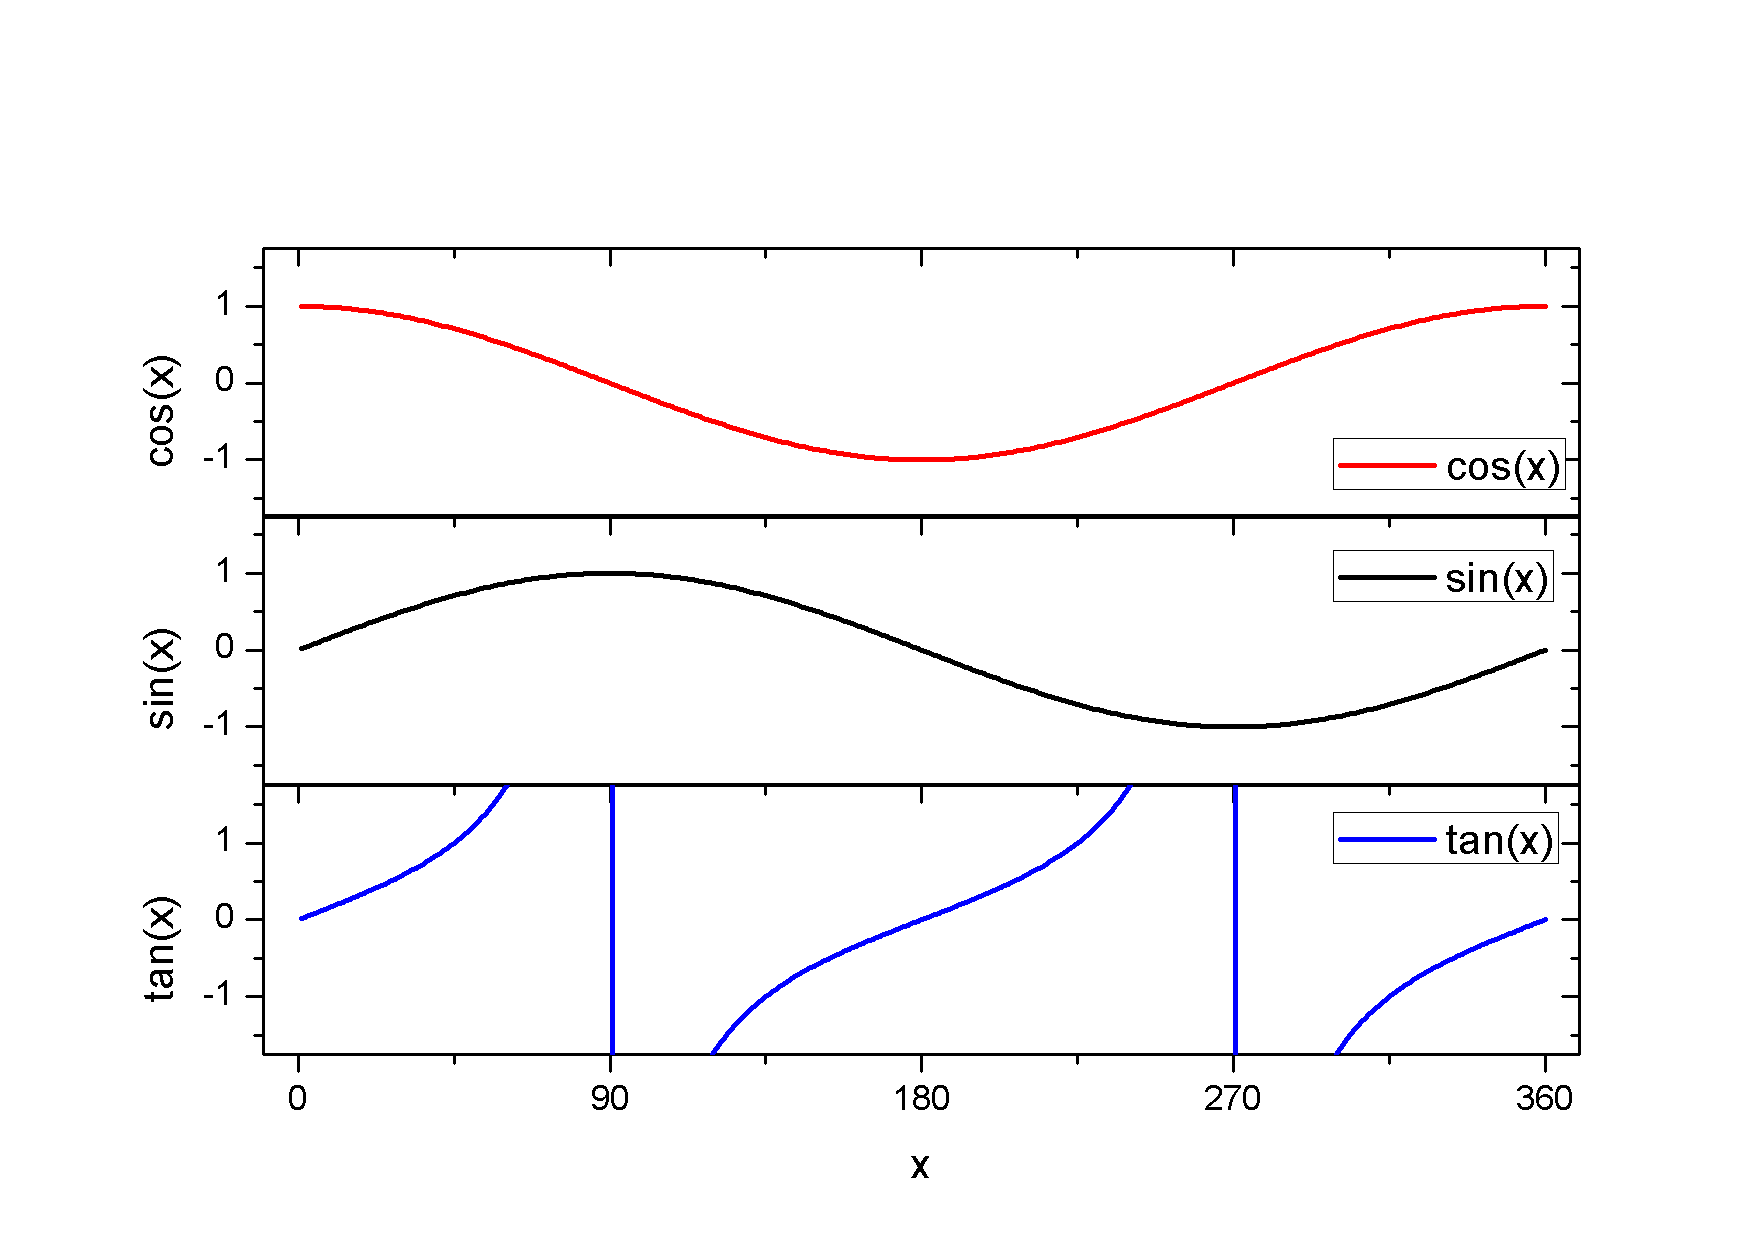
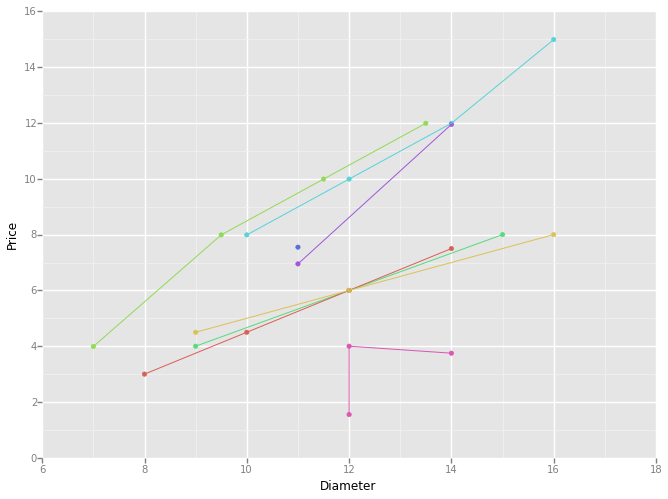
How to Create Subplots in Origin Subplots can be  a useful way to display data clearly. In this post I show you how to use Origin to plot data as subplots. This guide was made using Origin 8, but I imagine something similar should work with other origin versions. Plot Your Multiple Data Sets We… Read More »

ggplot for Python

ggplot for Python The ggplot library for python unlocks much of the philosophy and pretty graphics of ggplot2 for R. Try it out and make your data look nicer. Bringing ggplot to Python One of the ‘killer apps’ of the statistics package R is ggplot2, a plotting library based on the book The Grammar of… Read More »