Matplotlib XKCD Style Plots
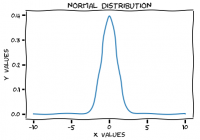
Matplotlib is the excellent workhorse plotting library for python. As great as matplotlib is, it could occasionally do with a little stylistic improvement [1] [2]. I recently came across a cool feature in matplotlib that lets you plot in the style of the popular XKCD comics, with a fun font and a more ‘sketchy’ line… Read More »