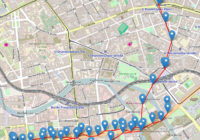
Live Transport Data Maps
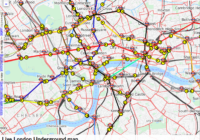
Transport is one area where the wide availability of data has made a big difference in recent years. Google mapsis probably the most obvious example, but there are also some other cool projects out there. Here I’ve picked out some cool map and visualisation projects that use live transport data to visualise transport systems around… Read More »