Plot Lines In Folium
In this post I show you how to plot lines in Folium - the python module for plotting leaflet maps.
Add PolyLine to Map
Like ‘markers’, lines are added to folium map objects with the add_to() method
1
folium.PolyLine(points).add_to(my_map)
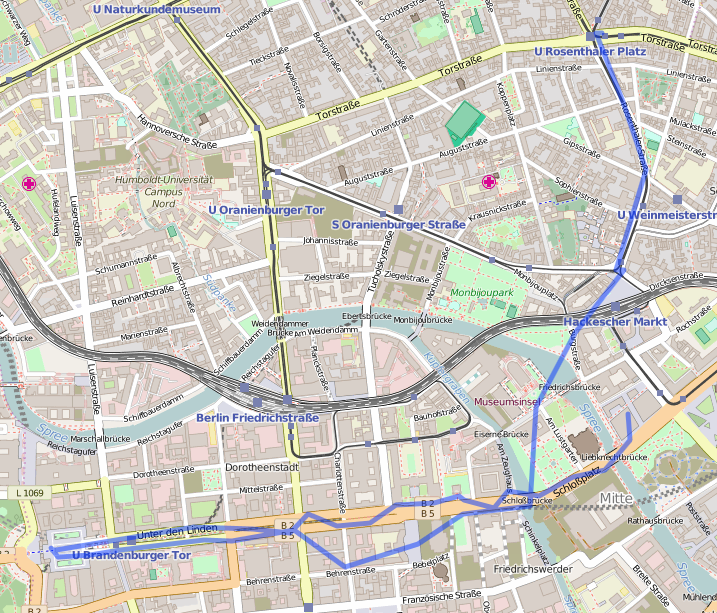
where “points” is a list of tuples containing latitude and longitude information, and “my_map” is a folium map object. By default this will give an output similar to:
 |
|---|
| default polyline |
Adjust Line Properties
We can alter the line properties (colour, weight and opacity) with:
1
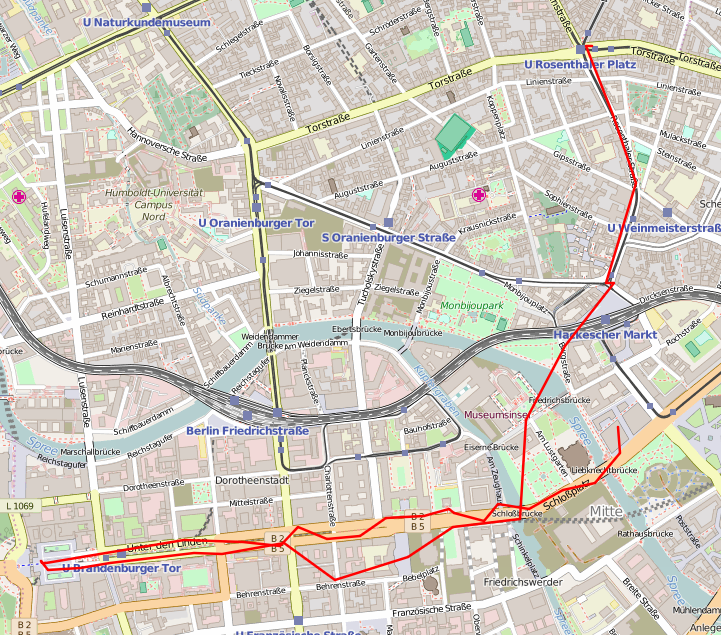
folium.PolyLine(points, color="red", weight=2.5, opacity=1).add_to(my_map)
 |
|---|
| Plot Lines In Folium - thin red line |
Plot Lines and Markers
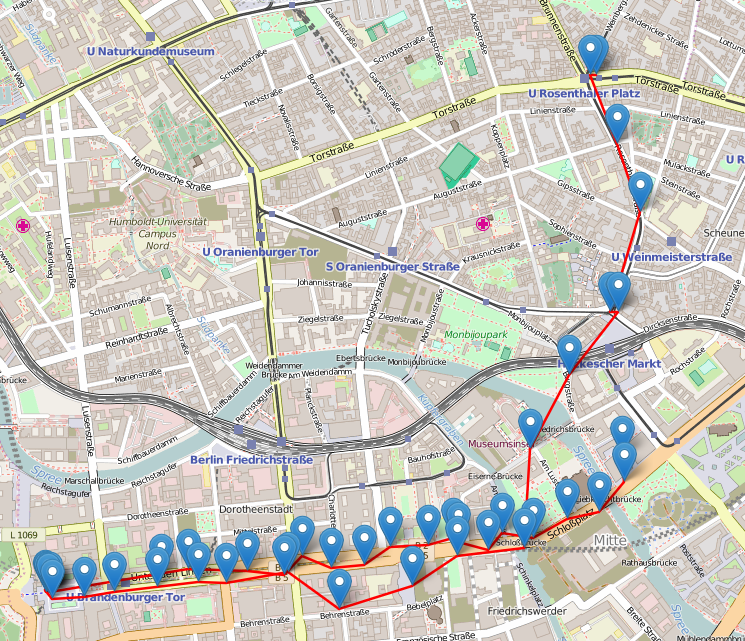
It can also be useful to plot both lines and markers on the same map. This can be easily done by using the Marker.add_to() method, and looping over each of the coordinate pairs in our list:
1
2
3
4
5
#add markers
for each in points:
    folium.Marker(each).add_to(my_map)
#add lines
folium.PolyLine(points, color="red", weight=2.5, opacity=1).add_to(my_map)
 |
|---|
| Plot Lines In Folium - line and markers |
An Example
Here’s an example involving loading in GPX coordinates from a GPS device. You can also download the code here.
1
2
3
4
5
6
7
8
9
10
11
12
13
14
15
16
17
18
19
20
21
22
import gpxpy
import gpxpy.gpx
import folium
gpx_file = open('path_to_gpx_file.gpx', 'r')
gpx = gpxpy.parse(gpx_file)
points = []
for track in gpx.tracks:
    for segment in track.segments:
        for point in segment.points:
            points.append(tuple([point.latitude, point.longitude]))
print(points)
ave_lat = sum(p[0] for p in points)/len(points)
ave_lon = sum(p[1] for p in points)/len(points)
# Load map centred on average coordinates
my_map = folium.Map(location=[ave_lat, ave_lon], zoom_start=14)
#add a markers
for each in points:
    folium.Marker(each).add_to(my_map)
#fadd lines
folium.PolyLine(points, color="red", weight=2.5, opacity=1).add_to(my_map)
# Save map
my_map.save("./gpx_berlin_withmarker.html")
This post is licensed under CC BY 4.0 by the author.