Tag Archives: data analysis

Sort Pandas Boxplots

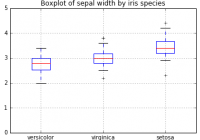
Make pandas boxplots more readable by sorting. Plotting with pandas dataframes usually works well, and makes it easy explore and visualise data. With simple pandas code like this: you can easily make charts like this from your dataframes: Sort Pandas Boxplots The default pandas boxplot easy easy to use, but it can be more clear… Read More »

Analysis With Impact

Few people really want to make decisions without evidence, but time pressures and competing priorities can make achieving analysis with impact difficult. This post explores some of the ways you can make sure your analysis makes a difference. Put Yourself in The Decision-Maker’s Shoes Think about the the person you would like your analysis to… Read More »

ggplot for Python

ggplot for Python The ggplot library for python unlocks much of the philosophy and pretty graphics of ggplot2 for R. Try it out and make your data look nicer. Bringing ggplot to Python One of the ‘killer apps’ of the statistics package R is ggplot2, a plotting library based on the book The Grammar of… Read More »