Tag Archives: data

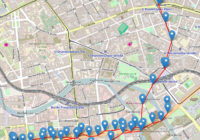
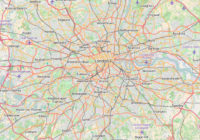
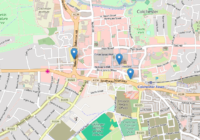
Folium Marker Clusters

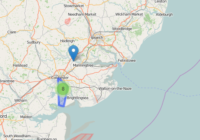
Marker clusters can be a good way to simply a map containing many markers. When the map is zoomed out nearby markers are combined together into a cluster, which is separated out when the map zoom level is closer. In this post I show you how Folium marker clusters are easy to set up and… Read More »

Plot Lines In Folium

In this post I show you how to plot lines in Folium – the python module for plotting leaflet maps. Add PolyLine to Map Like ‘markers’, lines are added to folium map objects with the add_to() method where “points” is a list of tuples containing latitude and longitude information, and “my_map” is a folium map… Read More »