How to Plot Polygons in Python
How to Plot Polygons In Python
This post shows you how to plot polygons in Python. When you’re working with polygons it can be useful to be able to plot them - perhaps to check that your operation has worked as expected, or to display a final result. The process to plot polygons in python can be different depending on whether you are happy to plot just the edges of the polygon, or you would also like to plot the area enclosed by the polygon.
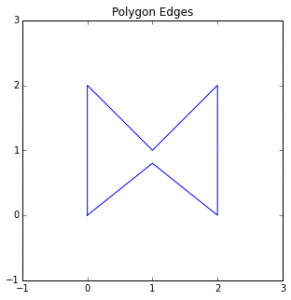
Plot Polygon Edges
 |
|---|
| Plot Polygons in Python - empty |
If you only want to plot the edges of the polygon things are quite simple. We can just extract the x and y coordinates and plot them using the matplotlib plotting library.
I’ve simplified the shapely example linearring.py to do this.
Download the code for plotting the edges of polygons
Import Modules
First we need to import the necessary modules:
1
2
from matplotlib import pyplot
from shapely.geometry.polygon import LinearRing, Polygon
Extract Polygon Coordinates
How exactly you extract the x and y coordinates depends on exactly what type of polygon you are using. In shapely a polygon object and a linearring object are very similar, but do differ in how we treat them.
Polygon Object
How to extract the x and y coordinates from a shapely Polygon object.
1
2
3
poly = Polygon([(0, 0), (0, 2), (1, 1),
    (2, 2), (2, 0), (1, 0.8), (0, 0)])
x,y = poly.exterior.xy
LinearRing Object
How to extract the x and y coordinates from a shapely LinearRing object.
1
2
3
ring = LinearRing([(0, 0), (0, 2), (1, 1),
    (2, 2), (2, 0), (1, 0.8), (0, 0)])
x, y = ring.xy
Plot the Polygon
Having extracted the x and y coordinates, we can plot the polygon with matplotlib:
1
2
3
4
ax = fig.add_subplot(111)
ax.plot(x, y, color='#6699cc', alpha=0.7,
    linewidth=3, solid_capstyle='round', zorder=2)
ax.set_title('Polygon')
Download the code for plotting the edges of polygons
Plot A Filled Polygon
 If you want to plot the filled area of the polygon, and not just the edges, you have to go a bit further. We’ll be using the same libraries as before, with the addition of descartes, which helps us to plot geometric objects with matplotlib patches. This is a simplified version of the cascaded_union.py shapely example.
Download the code for plotting filled polygons
1
2
3
from matplotlib import pyplot as plt
from shapely.geometry.polygon import Polygon
from descartes import PolygonPatch
And now we plot the polygon by generating and plotting a matplotlib patch:
1
2
3
4
5
6
fig = plt.figure(1, figsize=(5,5), dpi=90)
ring_mixed = Polygon([(0, 0), (0, 2), (1, 1),
    (2, 2), (2, 0), (1, 0.8), (0, 0)])
ax = fig.add_subplot(111)
ring_patch = PolygonPatch(ring_mixed)
ax.add_patch(ring_patch)
This will plot the polygon, but we’ll also do a few things to make it look nicer:
1
2
3
4
5
6
7
8
ax.set_title('General Polygon')
xrange = [-1, 3]
yrange = [-1, 3]
ax.set_xlim(*xrange)
ax.set_xticks(range(*xrange) + [xrange[-1]])
ax.set_ylim(*yrange)
ax.set_yticks(range(*yrange) + [yrange[-1]])
ax.set_aspect(1)
Download the code for plotting filled polygons