
Data science can mean different things to different people, but we can try to define it by the techniques a data scientist tends to use. A recent online poll gave a top 10 of algorithms and methods used by Data Scientists. This post goes through that top 10 list of data science techniques to flesh out more what it means to be a data scientist.
Regression
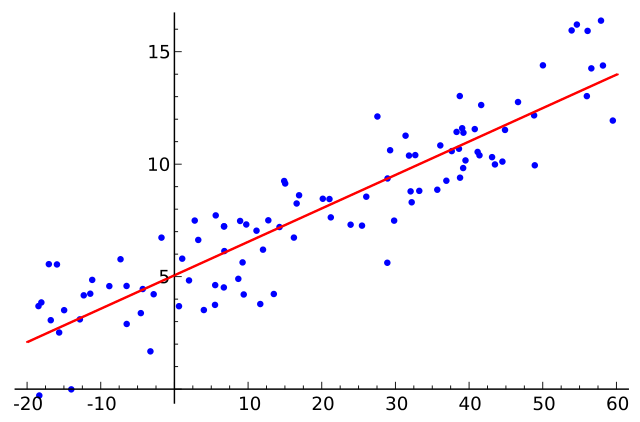
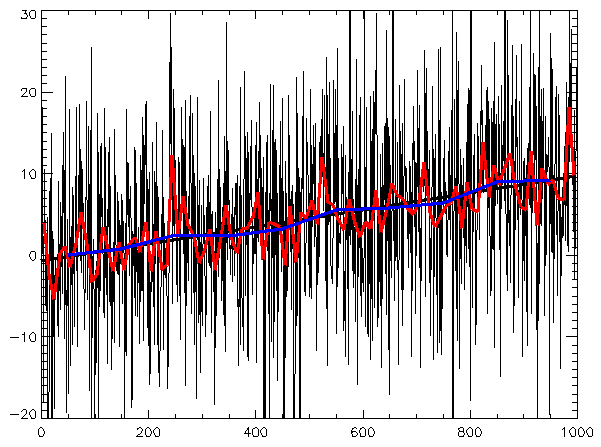
Regression (sometimes referred to as “fitting“) is a technique for characterising the relationships between variables. It can be used as a predictive tool or as a method for establishing a causal relationship between two or more variables. Regression analysis is used across sciences, economics as well as the world of business and beyond.
There are different types of regression analysis including, amongst others, linear, polynomial, and logistic regression. A common Regression analyses typically make some assumptions about the underlying data. These assumptions often include homoscedasticity, and having little or no multi-collinearity.
Find the Manga Guide to Regression Analysis on Amazon [Sponsored Link]
Clustering
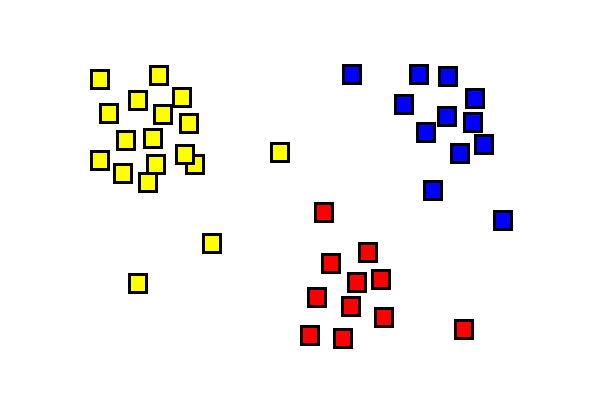
Clustering, as the name suggests, is about grouping data based on their attributes. Clustering is used in many different areas, such as marketing, biology, or astronomy where common attributes such as size or colour (for science) or buying history (for marketing) are used to form groups.
The basis of cluster analysis is to consider the distance between values of parameters describing the data of interest. Clusters can then be defined by grouping data elements which seem to be closely related.
Find Cluster Analysis and Data Mining: An Introduction on Amazon [Sponsored Link]
Decision trees/rules
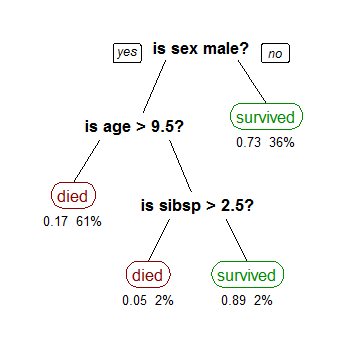
By Stephen Milborrow – Own work, CC BY-SA 3.0, Link
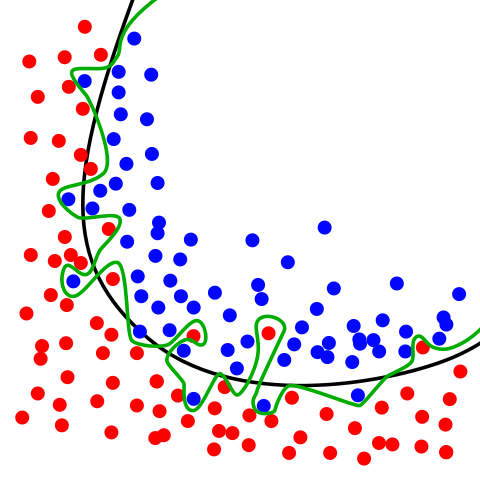
Decision tree methods can be used in data mining for both classification (such as determining which group a person belongs to), and regression (for example predicting likely house prices) of data sets. Decision trees map out a series of options within a process or classification system – they are known as trees as the options, and sub-options resemble the branches and leaves of a tree.
The basis of decision trees for data science is really just simple probability trees which, given a series of inputs, will predict the likelihood of various outcomes. These probabilities for the decision points are found from a training set, which can then be applied to the test set. These simple trees can be extended to allow more complex trees, which can be grown and adapted. Allowing initially simple trees to grow too far, however, can lead to over-fitting of the data.
Visualisation
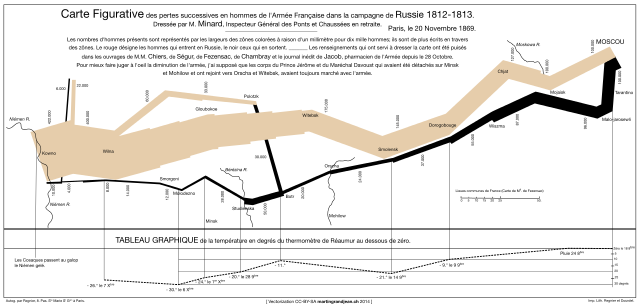
By Martin Grandjean – Own work http://www.martingrandjean.ch/historical-data-visualization-minard-map/, CC BY-SA 3.0, Link
Data science and analysis are nothing unless they can engage with people. Visualisation is the way to do this.
Data science frequently makes use of both static and dynamic visualisations, and there many libraries and modules available to easily turn data into stunning visuals. There are many tools out there to help you produce visualisations, although sometimes it’s good just to know which chart to use.
Data visualisation is not a new concept, and there are many examples from history of graphs, plots and other visualisations that made a key impact. Edward Tufte has written a series of seminal works on data visualisation, which others have drawn lessons from.
Find Edward Tufte’s seminal visualisation books on Amazon [Sponsored Link]
k-Nearest Neighbours
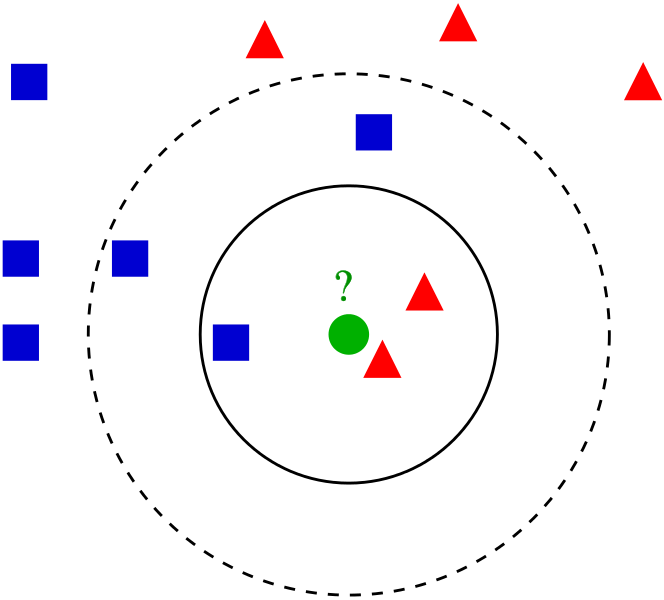
By Antti Ajanki AnAj – Own work, CC BY-SA 3.0, Link
k-Nearest neighbours, or k-NN, is another method for classification and regression. The method shares some similarities with the approaches used for clustering in that it compares test subjects to its neighbours in a feature space.
k-NN works on the assumption that if you have characteristics similar to your neighbours, you can are classified together with them. The approach starts with classifications for existing data, and their defining characteristics.
The k-NN method will then predict the appropriate class of a test sample, given its attributes. This differs from clustering approaches which attempt to find groupings of data given their parameters, rather than assigning new data to existing clusters.
One useful feature of the k-NN method is that it is non-parametric, which can make it more flexible than other regression techniques. This can make k-NN regression a compelling alternative to other regression methods.
Principal Component Analysis
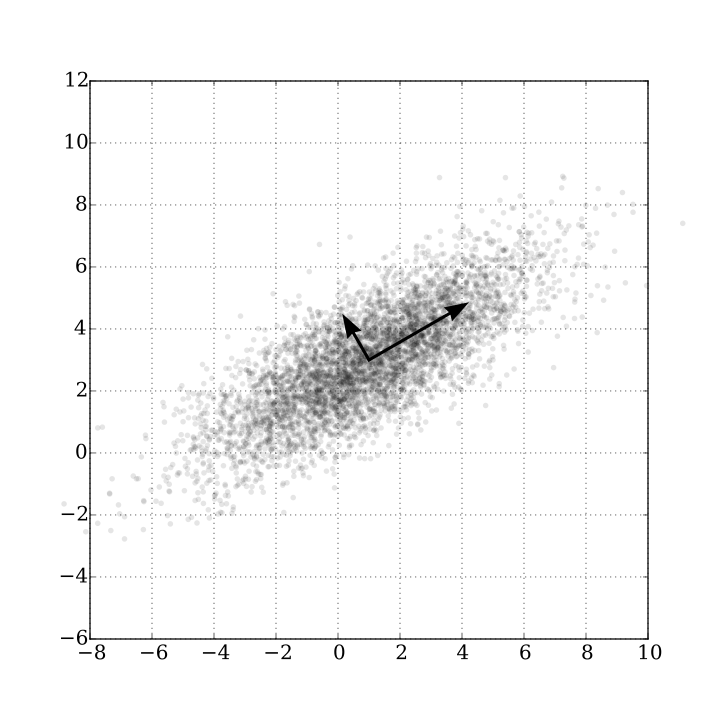
Principal component analysis is a technique which accentuates patterns in data and helps focus on variables responsible for most data variation. Principal components refer to the structure of the data which is responsible for the majority of the variance in it.
To find these principal components we can imagine drawing an ellipse around the data. Ellipses have two axes: semi-major (the ‘long’ axis) and semi-minor (the ‘short’ axis). The semi-major axis of our ellipse is the principal component.
PCA is often used to reduce the number of variables to investigate. By identifying ‘principal components’ – you can focus on those contributing most to variation. This makes principal component analysis particularly useful for analysing high-dimensional data.
Being able to select principal components does raise the components of which, or how many components to take. There is no right answer to this, but a good rule of thumb is to consider how much variation in your data you are happy to be explained (e.g. 95%, 99%), and examine as many components as are needed.
Statistics
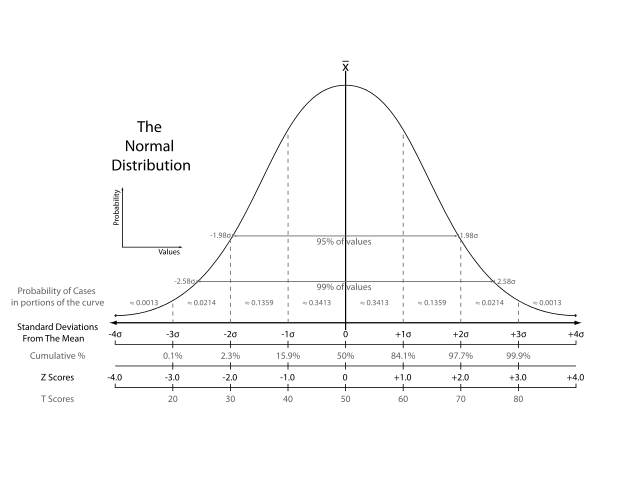 Statistics covers a whole wealth of techniques and methods, including many of those in this list. Statistics can include, amongst other things, data collection, hypothesis testing, statistical distributions, as well as applications in machine learning and data mining.
Data science certainly owes a lot to statistics and statisticians, and there are debates over whether ‘data scientists’ are really just dressed-up statisticians, or how much of machine-learning is ‘just’ statistics. The general feeling seems to be though that data science tends to build on statistics by exploring problems and posing questions in different ways to conventional statistics. No doubt the debate will rumble on.
Random Forests
Random forests (also known as random decision forests) are another method that can be used for both classification and regression. As its name suggests, this technique builds the concept of decision trees (a forest is a collection of trees).
Instead of just a single decision tree, Random forests averaging multiple decision trees, trained on different parts of the same training set. Random forest methods offer a way of improving the accuracy of classification and regression, while avoiding the problems of over-fitting that single decision trees often suffer.
Time Series
A time series is simply a series of data arranged in time order. As you might imagine, time series are found in many places including science, metereology, and the stock market. What often sets time-series data apart is that there may be time-dependent trends or seasonality that would not otherwise be present.
Techniques for analysing time series often involve accounting for the inherent randomised component in measurements, and employ a range of different smoothing approaches to remove randomness.
There are many techniques for the analysis and forecasting of time series. Since time series are just data like any other, they can be analysed with many standard regression and classification techniques. That said, there are some tools that are frequently used for time-series data in particular including frequency analysis techniques , control charts and autocorrelation.
Text Mining
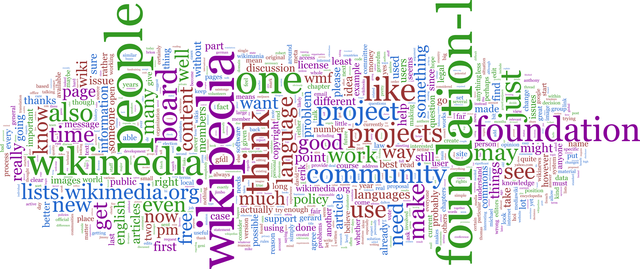 Text mining is about getting useful data from text information. Text mining has many applications including interpreting free-text responses to a survey, or analysing documents and customer feedback. Common questions answered by text mining are frequency of words found, counting sentences, or detecting behaviours.
Text mining often starts with the removal of stop words – these are common words which add little meaning to the body of text. The remaining words are then ‘stemmed‘ to group words with common stems, rather than treating them individually. For example the words ‘explorer’, ‘explored’ and ‘explores’ share a word stem of ‘explor’. Stemming these three words allow you to identify commonality around the stem ‘explor’.
The basis of much text mining is the document term matrix – a (often very sparse) matrix containing the frequencies of the words or word stems found in the documents analysed. An extension of looking at single words or word stems is analysis for ‘n-grams‘ – combinations of words or stems. This is the basis of Google’s n-gram viewer which lets you search for n-grams in thousands of published works.
Search Text Mining on Amazon [Sponsored Link]
Related to text mining is natural language processing (NLP) which uses similar techniques to text mining, but tends to involve more analysis of underlying structure and latent meaning rather than words themselves.
A common NLP technique is sentiment analysis. Sentiment analysis uses lexicons of sentiments linked to different words to get a sense of the feeling and meaning of a body of work. For example the word ‘abandon’ might be associated with the sentiment ‘fear’, while the word ‘shout’ might be associate with ‘anger’.
Search Natural Language Processing on Amazon [Sponsored Link]