Sort Pandas Boxplots
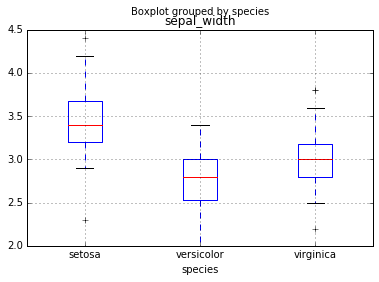
Make pandas boxplots more readable by sorting. Plotting with pandas dataframes usually works well, and makes it easy explore and visualise data. With simple pandas code like this:
1
df.boxplot(by="group", column="column_name")
you can easily make charts like this from your dataframes:
 |
|---|
| *Boxplot example - unsorted |
Sort Pandas Boxplots
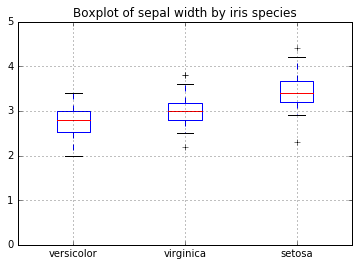
The default pandas boxplot easy easy to use, but it can be more clear to sort the categories by the size of the medians of each group. There doesn’t seem to be an obvious way to sort pandas boxplots like this, but I did find one solution on stack exchange. You can use this function to plot a sorted boxplot for the data.
1
2
3
4
5
6
7
8
9
10
11
12
def boxplot_sorted(df, by, column, rot=0):
    # use dict comprehension to create new dataframe from the iterable groupby object
    # each group name becomes a column in the new dataframe
    df2 = pd.DataFrame({col:vals[column] for col, vals in df.groupby(by)})
    # find and sort the median values in this new dataframe
    meds = df2.median().sort_values()
    # use the columns in the dataframe, ordered sorted by median value
    # return axes so changes can be made outside the function
    return df2[meds.index].boxplot(rot=rot, return_type="axes")
axes = boxplot_sorted(iris, by=["species"], column="sepal_width")
axes.set_title("Boxplot of sepal width by iris species")
axes.set_ylim([0,5])
This code should give an output like this:
 |
|---|
| Boxplot example - sorted |
In this boxplot I’ve also adjusted the y limits to start at zero.
How It Works
You can loop through a pandas groupby object, just like any python iterable. The code in the function above uses dictionary comprehension to create a dictionary from the grouped dataframe iterable. This dictionary object is in turn converted into a new dataframe object, with a column named after each group. The values in the column are the values from the group. The median of each column is calculated and the resulting dataframe has its index as the name of the group from the original dataframe, while the corresponding value is the median for that group. Sorting this dataframe by these median values (with .sort_values()) changes the order of this index. Finally, the function plots the dataframe in the order given by the median-sorted index.