Markov chains are a way of stochastically modelling a series of events where the outcome probability of an event depends only only on the event that preceded it. This post gives an overview of some of the theory of Markov chains and gives a simple example implementation using python.
Using Markov Chains to Model The Weather
A classic example of using Markov Chains is in modelling the weather. We know intuitively that if today is rainy then there is a good chance tomorrow will be rainy too. We might also expect it to be fairly likely to be cloudy, with only a small chance of being sunny. We can make similar judgements about what tomorrow’s weather will be like if it is cloudy or sunny today.
Transition matrix
We can write that slightly more formally in a table, also known as a transition of stochastic matrix:
| Weather today | P(rainy) | P(cloudy) | P(sunny) |
|---|---|---|---|
| rainy | 0.6 | 0.3 | 0.1 |
| cloudy | 0.5 | 0.3 | 0.2 |
| sunny | 0.2 | 0.1 | 0.7 |
We can use that table by selecting what the whether is like today and then looking up the different probabilities for the next day’s weather. For example if today is sunny then there is a 20% chance of it being rainy tomorrow, 10% chance of it being cloudy, and 70% chance of it being sunny again.
We can ‘chain’ together a series of such predictions, which is what Markov Chains are.
Graph Representation
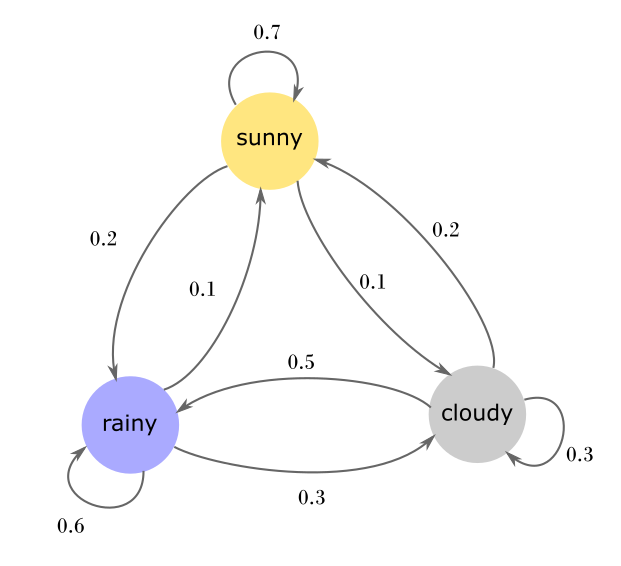
An alternative to the table-view is to think of the states and transitions as a graph:

Making Predictions
Here’s a five-day run using a 10-sided dice simulator to decide the next day’s weather:
| Day | Dice Roll | Predicted Weather |
|---|---|---|
| 1 | 9 | Cloudy |
| 2 | 6 | Cloudy |
| 3 | 2 | Rainy |
| 4 | 2 | Rainy |
| 5 | 1 | Rainy |
This works fine, but it seems rather arduous to have to work out each day’s prediction manually.
Markov Chains in Python
Instead of working through Markov chains manually we can use something like a python script. In this case it set up to predict the next 14 days, given that the today is sunny.
%matplotlib inline
import numpy as np
import matplotlib.pyplot as plt

transition_matrix = np.atleast_2d([[0.4, 0.1, 0.5],
                                   [0.2, 0.5, 0.3],
                                   [0.1, 0.4, 0.5]])

possible_states = ['sunny', 'rainy', 'cloudy']

start_state = 'sunny'
number_of_future_states_to_generate = 14

# We can make use of numpy's random choice functionality
# p are the probabilities associated with each of the possible
# states
# We need a way to select the correct row:
index_dict = {possible_states[index]: index for index in range(len(possible_states))}

# for example:
# transition_matrix[index_dict[start_state], :]

future_states = []
for i in range(number_of_future_states_to_generate):
    new_state = np.random.choice(possible_states, p=transition_matrix[index_dict[start_state], :])
    future_states.append(new_state)
For a single run, this code predicts the weather for the next five days as being:
['sunny', 'sunny', 'rainy', 'cloudy', 'sunny']