Raspberry Pi Carbon Dioxide Monitor
This post shows how to make a Raspberry Pi Carbon Dioxide Monitor using a raspberry pi connected to a USB carbon dioxide monitor. The project is deliberately bare bones and leaves several opportunities for refinement, improvement and general tinkering.
What we are aiming to make
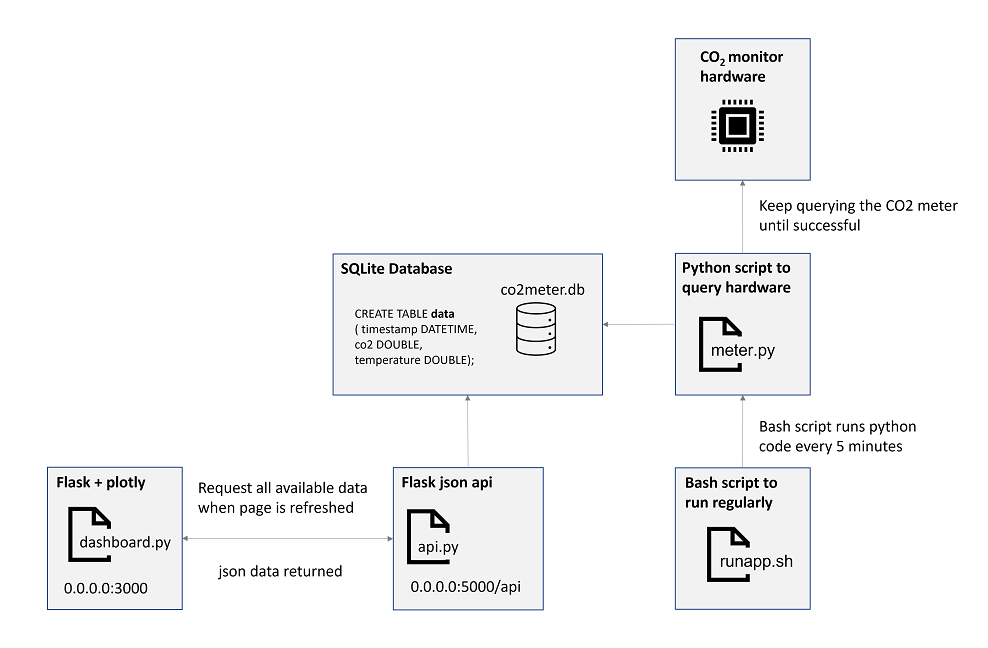
The following schematic shows what we will be building up to:
- The actual CO2 monitor hardware, which is just a commercial carbon dioxide monitor with USB interface.
- Python script to query the monitor hardware and store results in a SQLite database
- A bash script to regularly run the hardware-querying python script
- An API for the sqlite database using
- A dashboard for the carbon dioxide monitor using flask and plotly
 |
|---|
| Carbon Dioxide Monitor Schematic |
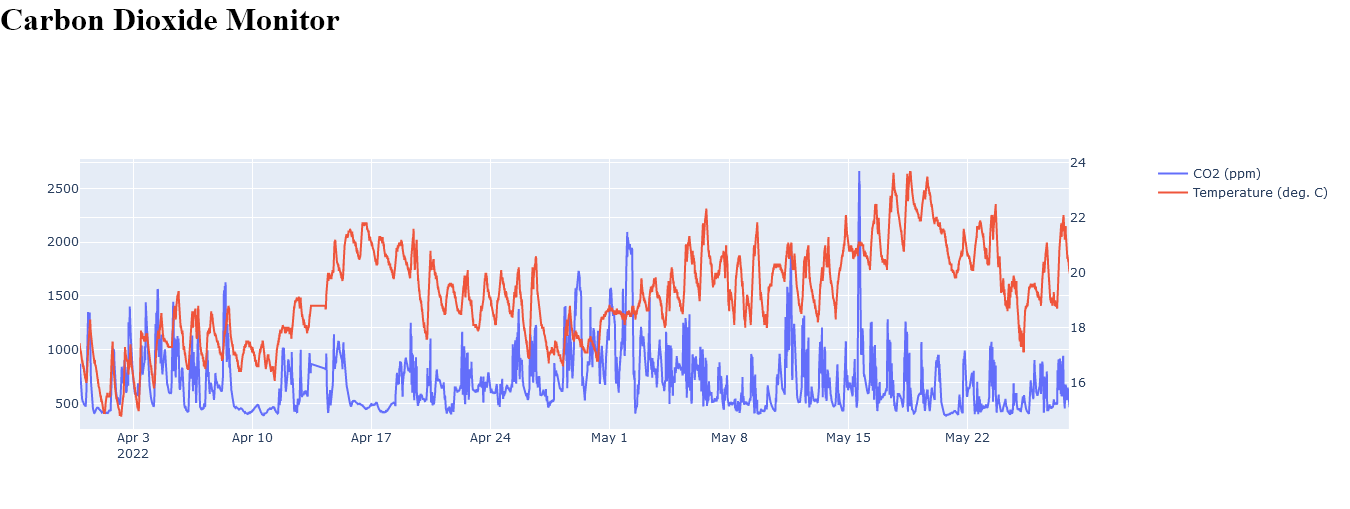
The resulting dashboard looks like this:
 |
|---|
| raspberry pi carbon dioxide monitor - dashboard |
Prerequisites
Before getting going with this project there are a few prerequisites you should check you have first:
- Raspberry Pi
- CO2 Meter device like this
- Copy of this code
- running on Linux - probably need sudo access
- Python packages
- flask
- plotly
- requests
Quick Start
Follow these steps if you just want to try out the code without looking at it in detail. Get the code from GitHub.
1
source venv/bin/activate
It’s probably easier to run each of the following commands in a separate terminal window.
Setting up a SQLite Database
We configure a SQLite database so we can store data from the carbon dioxide meter. The SQLite database is stored in a file ‘co2meter.db’. Read about how to create a sqlite database. And then we create a single table in that database called ‘data’. Read more about creating a table.
1
2
3
4
CREATE TABLE data
( timestamp DATETIME,
co2 DOUBLE,
temperature DOUBLE);
We will write it to a sqlite database so we can easily query it later for what we have in mind.
Start collecting Data
1
bash runapp.sh
This assumes you have configured your user to have hidraw access as per the CO2Meter readme. If you have followed the instructions and it still isn’t working, you may need to restart your machine/raspberry pi.
Start sharing data
Run
1
python3 api.py
Start visualising data
Run
1
python3 dashboard.py
Basic interaction with the co2 meter
The co2meter.py code conceals quite a bit of complexity, and the only commands you really need to worry about are
- get_data
- get_co2
- get_temperature
I found that this code worked best for me if I ran the commands in ‘sudo’ mode, although you may find success if you follow the hidraw access instructions and reset your raspberry pi before continuing.
Code overview
The following code creates a connection to the hardware carbon dioxide meter as well as the SQLite database we created. A ‘while’ loop keeps trying to poll the carbon dioxide meter until a complete response is returned. Without this, it is possible for queries to the meter to return empty. The code also prints out the same data so it could, in theory, be more easily captured directly within Linux. Once a full, correct response from the carbon dioxide meter has been received, the code finishes.
1
2
3
4
5
6
7
8
9
10
11
12
13
14
15
16
17
18
19
20
21
22
23
24
25
26
27
#!/bin/env python
import time
import sqlite3
from datetime import datetime
from CO2Meter import *
Meter = CO2Meter("/dev/hidraw0")
conn = sqlite3.connect("co2meter.db")
cursor = conn.cursor()
no_measurement = True
while no_measurement:
    measurement = Meter.get_data()
    measurement.update({'timestamp': datetime.now()})
    try:
        print(measurement['timestamp'].strftime("%Y-%m-%d %H:%M:%S"),
        measurement['co2'],
        measurement['temperature'],
        sep=","
        )
        cursor.executemany("INSERT INTO data VALUES (?,?,?)",
                [(measurement['timestamp'].strftime("%Y-%m-%d %H:%M:%S"),
                    measurement['co2'],
                    measurement['temperature'])]
                    )
        conn.commit()
        no_measurement = False
    except Exception as e:
        pass # not all calls result in data to display
Getting Regular Updates
I wanted to keep different elements of the project well separated so that, in theory at least, I could tweak and improve each one separately. Using a separate bash script to regularly run a python script is an example of this. One of the decisions to make at the data collection stage is how frequently to collect it. I went for 5 minutes (300 seconds) as it seemed to capture variation in the data without massively oversampling.
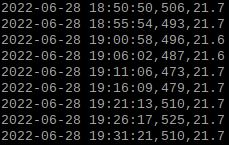
Example Output
 |
|---|
| Regular Updates |
Code Overview
This simple bash script runs until it is cancelled. Every 5 minutes (300 seconds) the script runs the main meter.py script. As shown in an earlier section, the meter.py script itself handles writing the data to a sqlite database. Alternatively, this bash script picks up the ‘print’ outputs from the python script and writes them to a separate ‘data.dat’ file. Note the use of ‘sudo’ to get around issues with access to hidraw.
1
2
3
4
5
while true;
do
	sudo python3 meter.py
       	sleep 300;
done
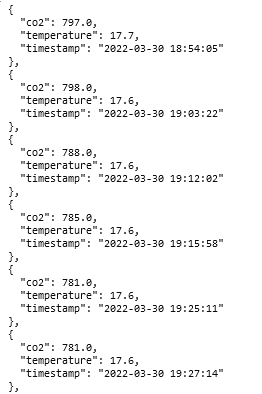
Exposing the data with a Flask API
At this stage we have a python script which writes data to a sqlite database. To expose this data to other services or devices on a local network we will use a flask app to create an API. We can use flask to make a simple rest api for the data. More complexity would be possible, but for now we’ll just keep it simple.
Example Output
 |
|---|
| API raw data example |
Code Overview
Creates a single ‘monitor’ endpoint which will return the contents of the co2meter.db database in json format
1
2
3
4
5
6
7
8
9
10
11
12
13
14
15
16
17
18
19
20
21
22
23
24
25
26
27
28
import sqlite3
from flask import Flask, request, make_response, jsonify
import io
import os
import csv
app = Flask(__name__)
database_name = 'co2meter.db'
def get_db():
    conn = sqlite3.connect(database_name)
    return conn
def get_data():
    db = get_db()
    cursor = db.cursor()
    statement = "SELECT * FROM data"
    cursor.execute(statement)
    return cursor.fetchall()
@app.route('/api')
def api():
    data = get_data()
    columns = ['timestamp', 'co2', 'temperature']
    result =  [{'timestamp': row[0], 'co2': row[1], 'temperature': row[2]}for row in data]
    return jsonify(result)
@app.route('/')
def myapp():
    message = "To use this app: %sapi" % request.base_url
    return message
if __name__ == '__main__':
    app.run(debug=True, port=5000, host='0.0.0.0')
Viewing the Data with Flask and Plotly
The final step is to actually make the data available for a user to easily view and interpret. The Flask API serving JSON data provides quite a bit of flexibility for how to do that. I opted to make a dashboard using a plotly along with a separate flask app. Plotly can play nicely with pandas dataframes, but since I wanted to keep the dependencies for this project relatively light, I implemented the plotly chart without pandas. This section borrows from this blog post which shows how you can create a dashboard using plotly without dash. I found that dash could not install onto my raspberry pi.
Example Output
| | |:–:| | raspberry pi carbon dioxide monitor - dashboard |
Code Overview
Does a get request from the api created earlier Uses plotly to create a simple dashboard (without using ‘dash’) Makes the dashboard available on port 3000
1
2
3
4
5
6
7
8
9
10
11
12
13
14
15
16
17
18
19
20
21
22
23
24
25
26
27
28
from flask import Flask, render_template
import json
import requests
import plotly
import plotly.graph_objects as go
from plotly.subplots import make_subplots
app = Flask(__name__)
@app.route('/')
def notdash():
    r = requests.get('localhost:5000/api')
    data = r.json()
    co2 = [x['co2'] for x in data]
    temperature = [x['temperature'] for x in data]
    timestamp = [x['timestamp'] for x in data]
    fig = make_subplots(specs=[[{'secondary_y': True}]])
    fig.add_trace(go.Scatter(x=timestamp,
                             y=co2,
                             name="CO2 (ppm)"),
                             secondary_y=False
                )
    fig.add_trace(go.Scatter(x=timestamp,
                             y=temperature,
                             name="Temperature (deg. C)"),
                             secondary_y=True)
    graphJSON = json.dumps(fig, cls=plotly.utils.PlotlyJSONEncoder)
    return render_template('dashboard.html', graphJSON=graphJSON)
if __name__ == '__main__':
    app.run(host='0.0.0.0', port=3000, debug=True)
This flask app for the dashboard also needs a file ‘dashboard.html’ in a ‘templates’ directory. This html file is a template into which a ‘graphJSON’ object can be passed.
1
2
3
4
5
6
7
8
9
10
<html>
	<body>
		<h1>Carbon Dioxide Monitor</h1>
		<div id='chart' class='chart'></div>
	</body><script src='https://cdn.plot.ly/plotly-latest.min.js'></script>
	<script type='text/javascript'>
		var graphs = ;
		Plotly.plot('chart', graphs, {});
	</script>
</html>
Possible refinements
This example raspberry pi carbon dioxide monitor is deliberately rough and leaves lots of areas for development or refinement, such as:
- Use cron rather than bash script with timer -> blog post on cron vs regular bash script
- Host a dashboard to view and explore data rather than just an api to pick up with Excel -> blog post on flask data dashboard / plotting
- Make a virtualenv - quick post on creating a virtualenv (and alternatives?). Maybe reference conda?
- Use pyusb rather than hidraw? I think this would require some rework of the co2meter.py code
- Implementing using a different pattern other than database + api e.g. pub/sub
- Query by date range - min and max, need update the api
- Higher frequency polling of co2 meter, then just sampling from the stream
There are many options for what to do with the data once captured e.g.
- csv
- json
- database
- queue?
- pub/sub?
Again, there are multiple options for how to view the data, such as:
- Load and process the data with python
- Point Excel at the api
- Use a tool such as power bi
- Plot the data in a browser with javascript
Related Projects and Posts
A more comprehensive co2meter approach Background on reverse engineering the co2 meter