Python Dashboard
This post shows you how to make a python dashboard using dash. Dash combines the plotly plotting library with the flask server to host the dashboard.
Python Dashboard with Dash
Dash is a powerful, flexible package and this short guide only scratches its surface. It will show how to make simple python dashboard consisting of three charts in a layout. This guide builds on the official dash documentation and assumes you have already installed dash.
A simple start
This is just a very minimal python dashboard implemented in dash. In this simple example we’ll look at creating and adding charts to a grid layout dashboard. The general idea is to use python to build up html components to represent your dashboard. It helps to have some rudimentary understanding of html layout, but it isn’t essential.
The full code for this example is below, but I wanted to pick out some particular sections to explain in more detail.
Preparing Figures
Figures in dash are handled via the plotly API. You can read more in the documentation, but essentially you can select different plots such as bar, scatter or violin plots to represent your data.
1
2
3
figure_1 = px.scatter(dataframe_1, x="x", y="y")
figure_2 = px.scatter(dataframe_2, x="x", y="y")
figure_3 = px.scatter(dataframe_3, x="x", y="y")
Plotly accepts pandas dataframes as inputs, which means you can easily load external data or prepare data in a different process for passing to your plotly dashboard. In the example below I have generated some random data for plotting, but you could equally load a csv file from disk or a remote location for example.
1
2
3
dataframe_1 = pd.DataFrame({'x': np.random.rand(50), 'y': np.random.rand(50)})
dataframe_2 = pd.DataFrame({'x': np.random.rand(10), 'y': np.random.rand(10)})
dataframe_3 = pd.DataFrame({'x': np.random.rand(5), 'y': np.random.rand(5)})
Defining the Layout
The format and layout of the dashboard is set using the dash html components. In the example below a mixture of ‘divs’ and headings are used to create a simple layout. In dash, elements can be passed into Divs as a list. For example:
1
html.Div(['element1', 'element2', 'element3', 'element4'])
would result in:
1
element1element2element3element4
Columns can be achieved with nested ‘html.Div’ statements. For example:
1
html.Div([html.Div(['element1', 'element2']), html.Div([ 'element3', 'element4'])], style={'columnCount': 1})
yields:
1
2
element1element2
element3element4
The Full Code
The full code for this simple example is below and can be run with python app.py. The resulting dashboard will look like this:
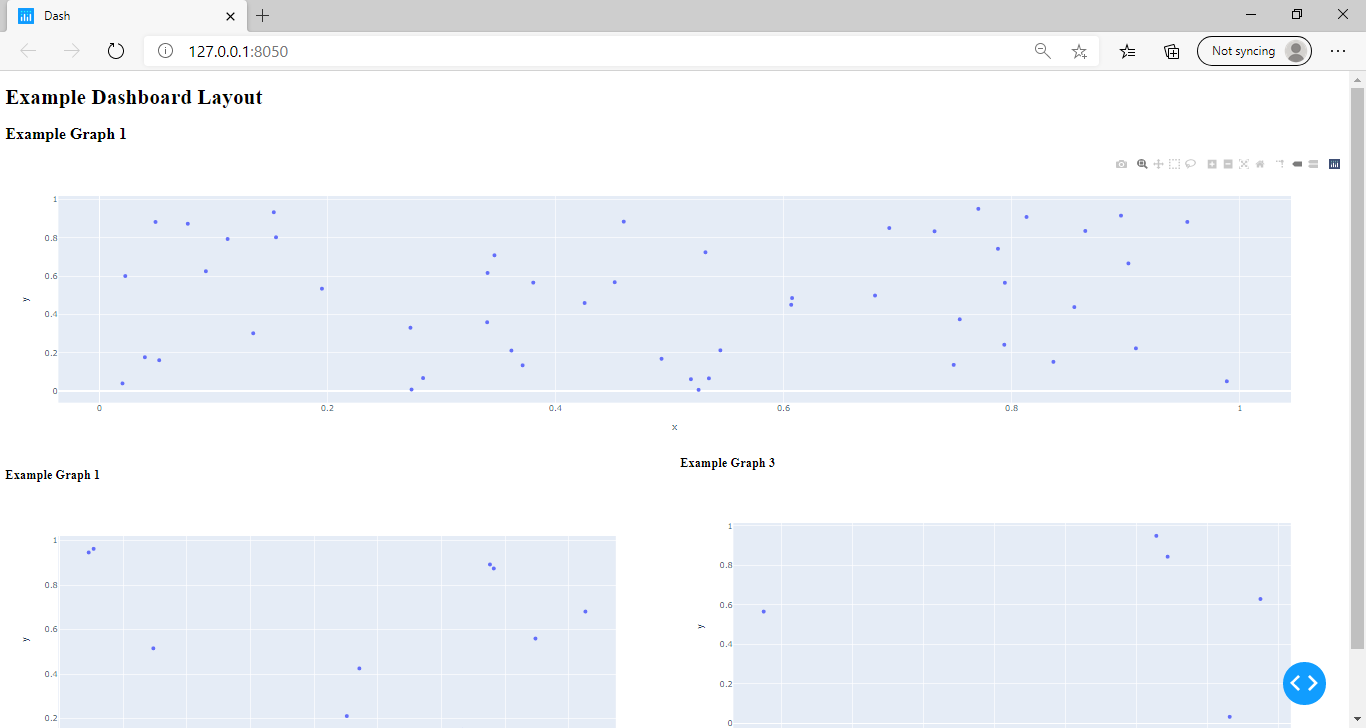 |
|---|
| Python Dashboard |
Try playing around with the code to change the dashboard layout.
1
2
3
4
5
6
7
8
9
10
11
12
13
14
15
16
17
18
19
20
21
22
23
24
25
26
27
28
29
30
31
32
33
34
35
36
37
38
39
40
41
42
43
44
45
46
import dash
import dash_core_components as dcc
import dash_html_components as html
import plotly.express as px
import pandas as pd
import numpy as np
# Data is defined as pandas dataframes
# This could be from anywhere e.g. loaded from API, local csv file etc.
dataframe_1 = pd.DataFrame({'x': np.random.rand(50), 'y': np.random.rand(50)})
dataframe_2 = pd.DataFrame({'x': np.random.rand(10), 'y': np.random.rand(10)})
dataframe_3 = pd.DataFrame({'x': np.random.rand(5), 'y': np.random.rand(5)})
app = dash.Dash(__name__)
# figures are built up based on plotly API
# see https://plotly.com/python/px-arguments/ for more details
figure_1 = px.scatter(dataframe_1, x="x", y="y")
figure_2 = px.scatter(dataframe_2, x="x", y="y")
figure_3 = px.scatter(dataframe_3, x="x", y="y")
# Main dashboard layout is built up from html elements
app.layout = html.Div([
            html.H1('Example Dashboard Layout'),
            html.Div([
                    html.H2('Example Graph 1'),
                    dcc.Graph(
                            id='example-graph-1',
                            figure=figure_1
                            ),
                    ]),
                    html.Div([
                        html.Div([
                            html.H3('Example Graph 1'),
                            dcc.Graph(
                                    id='example-graph-2',
                                    figure=figure_2
                                    ),
                        ]),
                        html.Div([
                            html.H3('Example Graph 3'),
                            dcc.Graph(
                                    id='example-graph-3',
                                    figure=figure_3
                                    ),
                        ])
                    ], style={'columnCount': 2})
            ])
if __name__ == '__main__':
    app.run_server(debug=True)