What Are Confidence Intervals?
Confidence intervals are the range often provided alongside other statistics. As their name suggests, they somehow convey a degree of uncertainty in the statistic quoted, but what actually are confidence intervals? And how can we get an intuitive understanding of them?
This post goes into some of the theory behind confidence intervals and points you to a great interactive tool for understanding them.
Interpreting Confidence Intervals Isn't Easy
Confidence intervals are about transferring measurement of sample statistic, such as median or mean, to an inference about the statistic for the whole population.
As a somewhat extreme example, you would probably not have much confidence that a single sample of the height of one person closely resembled the actual average height of a whole country. Confidence intervals are a way of formalising that intuition. It makes conceptual sense that a confidence interval is somehow related to how ‘sure’ we are about a number. But there are many incorrect ways to interpret that idea of being ‘sure’.
A common incorrect interpretation is that the 95% confidence interval tells us that there is a 95% chance that the true, population statistic lies within that range. This feels right, but doesn’t make sense. The population statistic is fixed - us doing a sample doesn’t change it - so the population statistic either is or is not inside the range of the confidence intervals.
The Correct Interpretation
The correct interpretation is that if we did many samples, we would expect the population statistic to be inside the intervals 95% of the time (for a 95% confidence interval). This subtly different interpretation now works with the idea that the true population statistic is fixed.
- First sample: population statistic is inside the interval.
- Second sample: population statistic is this time outside the interval.
- Third sample: population statistic is once again inside the interval
- ... and so on.
The underlying population does not change as we sample it, but the sample itself does ‘dance around’ the population statistic. I think this is what can make the concept of the confident interval difficult to grasp - it is not inherent to a single sample, rather it sets what the expected outcome would be if many samples were taken.
An Interactive Tool Can Help
I’ve tried to avoid discussing the maths behind confidence intervals, but so far I’ve still been rather wordy. A good way to intuitively understand the correct interpretation of confidence intervals is the interactive tool on this page from the Khan Academy.
With the tool you can play with confidence interval and sample size and see how many times the population mean is within the confidence interval of the sample.
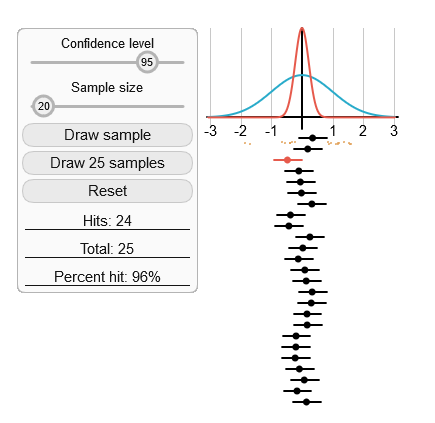 |
|---|
| Screenshot of interactive tool |
Read more about the correct interpretation of confidence intervals.