UK Rainfall Data
Historic UK Rainfall Data
The Met Office Hadley Centre holds (Met Office Hadley Centre observations datasets HadUKP) UK Rainfall Data going back to the 1800s. It records the daily average rain fall for 9 regions around England, Wales, Scotland and Northern Ireland. You can download the data from here: Met Office Hadley Centre HadUKP Data Download See terms and conditions for using this data: Met Office Hadley Centre hadukp observations datasets
Exploring Daily Total Rainfall
One of the more granular sources provided by the Hadley Centre is daily rainfall totals for each region. You can download the individual files from the website, but unfortunately it looks like their robots.txt prevents programmatic downloading of the files. Once downloaded you can use pandas read_csv to load the data into a pandas dataframe. A couple of things to watch out for though:
- Skipping the first few rows and specifying that there is no header row. See here for how to get around that.
- Using more than one space character as a column separator. See here for how to get around that.
- Handling NA values (which are set as -99.99 and mess up calculations). See here for how to get around that.
The full line I used was:
1
df = pd.read_csv('data/HadSWEP_daily_qc.txt', sep=r'\s+', skiprows=3, skipinitialspace=True, header=None, na_values=-99.99)
Since the file did not come with its own header columns I added them after loading the file. I also added a column for region so that multiple regions could be handled at once if necessary (‘SEEP’ is from the original data file and means ‘South East England Precipitation’).
1
2
df.columns = ['year', 'month']+ [i+1 for i in range(31)]
df['region'] = 'SEEP'
The data table provided is in a ‘wide’ format with a column for each day of the month. This is helpful for human-readability, but isn’t so good for computer processing. To convert for a ‘wide’ to a ‘long’ form table we can use the ‘melt’ pandas method. Read more about pandas melt
1
2
melted = pd.melt(df, id_vars=['region', 'year', "month"],
                 var_name="day", value_name="rainfall")
Example Analysis
The melted dataframe is in a good place to do further analysis and get a feel for what is possible.
How Much Rain Will There Be?
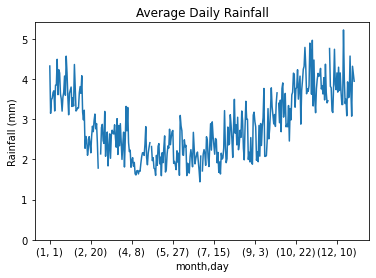
We can attempt to estimate how much rain there will be on a given day of the year by looking at that average for that day. This isn’t really forecasting, but it does help you know generally how rainy a given day of the year might be.
1
df2 = melted[melted['region']=='SEEP'].groupby(['month', 'day'])['rainfall'].mean()
We can plot this new grouped dataframe and confirm that the trends to at least seem to mostly make sense: the summer is relatively dry and the winter is relatively wet.
 |
|---|
| UK Rainfall Data - average daily rainfal |
Having the mean rainfall is one thing, but often we want to dig a bit deeper than that. We can easily extend our initial ‘mean’ calculation to include maximum, minimum and standard deviation of rainfall measurements. Read more about multiple aggregations and also here
1
2
3
4
5
6
7
8
9
import numpy as np
df3 = melted[melted['region']=='SEEP'].groupby(['month', 'day']).agg(
    mean_rain=pd.NamedAgg(column='rainfall', aggfunc='mean'),
    max_rain=pd.NamedAgg(column='rainfall', aggfunc='max'),
    min_rain=pd.NamedAgg(column='rainfall', aggfunc='min'),
    std=pd.NamedAgg(column='rainfall', aggfunc=np.std),
)
df4 = df3.reset_index()
df4.head()
How Likely Is it to Rain?
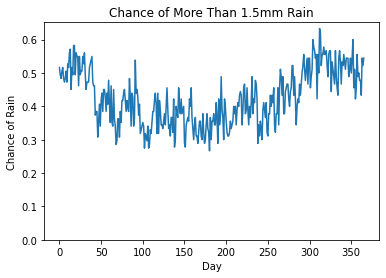
We can also use this historic UK rainfall data to give some estimate as to the chance of rain on a given day. I want to stress again that this isn’t really forecasting, or at least I wouldn’t rely on it for anything important!
Since I have put an additional region column, we also need to filter on that. Read about filtering with pandas. The basic idea is that you count up all days in the past which had rain above a certain limit and divide by the total number of days. From one forum (here and here) it looks like about 1-2mm rain across a day would likely not get in anybody’s way, so I have used that as the threshold rather than simply 0mm which is probably a bit too strict.
1
2
3
4
5
LIGHT_RAIN_LIMIT = 1.5
df4['count_rain'] = melted[(melted['region']=='SEEP') & (melted['rainfall']>LIGHT_RAIN_LIMIT)].groupby(['month', 'day'])['rainfall'].count().reset_index()['rainfall']
df4['count_not_rain'] = melted[(melted['region']=='SEEP') & (melted['rainfall']<=LIGHT_RAIN_LIMIT)].groupby(['month', 'day'])['rainfall'].count().reset_index()['rainfall']
df4['chance_rain'] = df4['count_rain'] / (df4['count_rain'] + df4['count_not_rain'])
df4['chance_rain'].plot(ylim=0,title="Chance of More Than 1.5mm Rain", xlabel="Day", ylabel="Chance of Rain")
 |
|---|
| UK Rainfall Data - chance of rain |
Other Sources of UK Rainfall Data
You may also be interested in other UK Rainfall data such as the CEDA archive and the Met Office.